Example Visualization: Difference between revisions
No edit summary |
No edit summary |
||
| (One intermediate revision by the same user not shown) | |||
| Line 3: | Line 3: | ||
<math>R_{\mu v}-\frac{1}{2}Rg_{\mu v} = 8 \pi T_{\mu v}</math> | |||
| Line 18: | Line 18: | ||
[[Category:Graph, Wall, Tome]] | [[Category:Graph, Wall, Tome]] | ||
[[Category:Archive]] | [[Category:Archive]] | ||
Latest revision as of 16:49, 19 February 2023
Imagine: It's 1915, and you've made one of the greatest discoveries in hundreds of years. You visit your mother and show her your work:
[math]\displaystyle{ R_{\mu v}-\frac{1}{2}Rg_{\mu v} = 8 \pi T_{\mu v} }[/math]
'That's nice dear', she responds, unaware of the implications of your discovery.
The problem, is that although this equation carries with it the secrets of gravity, to a layman it is merely a bunch of letters and symbols.
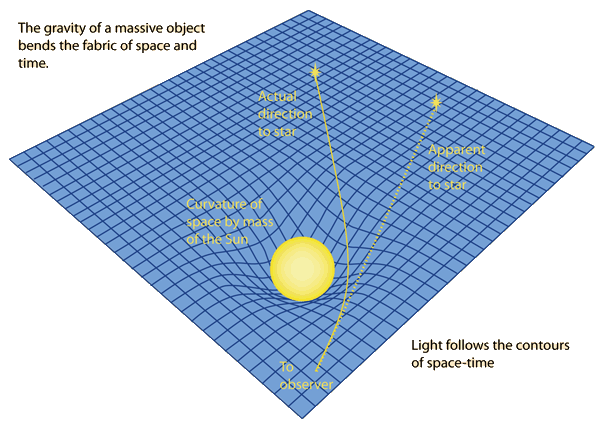
Now, consider this single image.
Instantly, the meaning becomes clear. Gravity warps space(time), and matter, planets, and even light follows a path that is curved by the warped geometry.

